Energy Investor Monthly – January 2026
INSIGHTS OF THE MONTH
Why a WW II–Era System Still Shapes the U.S. & Global Energy Markets
Fans of the original 1960’s Star Trek series may remember the 23rd-century Apple iPad equivalent, the Personal Access Display Device, or PADD. However, there is a far more important, but unrelated, version that allows both the U.S. Department of Energy (DOE) and the energy industry to monitor the movement of crude oil and petroleum products nationwide. Known as the Petroleum Administration for Defense Districts, or (PADDs) for short, these five geographic districts (and sub-districts) are connected by critical pipeline and storage infrastructure that makes tracking the flow of oil and related energy products easy and transparent. More importantly, Federal agencies, energy companies, traders, and policymakers use PADD data to assess regional fuel markets, monitor supply disruptions, make informed policy decisions, and analyze price behavior.
Historical Background – WWII and the Cold War
The original PADD system was established during World War II, when the Petroleum Administration for War (established in 1942) used the districts to allocate gasoline and manage the U.S. wartime fuel needs. Although the agency was disbanded in 1946, Congress revived the framework in 1950, during the Korean War and at the height of the Cold War with the Soviet Union, under the Defense Production Act, creating the current Petroleum Administration for Defense. The five original districts were kept intact and renamed the Petroleum Administration for Defense Districts, hence the PADDs designation used today.
The Five Major PADD Regions
The Petroleum Administration for Defense Districts (PADDs) divides the 50 U.S. states and the District of Columbia into five major geographic regions (see below) that are used for tracking and analyzing petroleum supply, demand, and movements. Each represents a distinct energy market with unique infrastructure, supply sources, and consumption patterns.
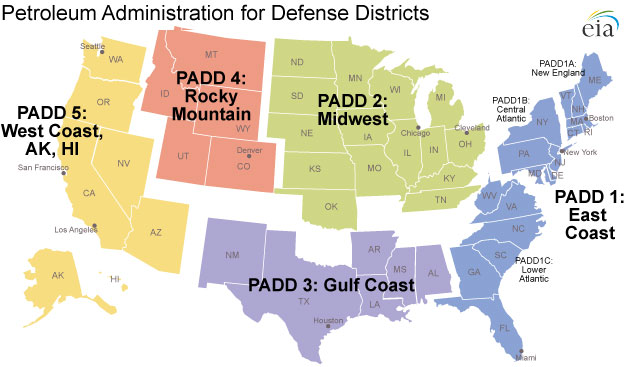
These PADD regions and sub-districts are:
PADD 1 – East Coast – PADD 1 is the most populous region, and because of this, it is further divided into three sub-districts:
PADD 1A: New England
PADD 1B: Central Atlantic
PADD 1C: Lower Atlantic
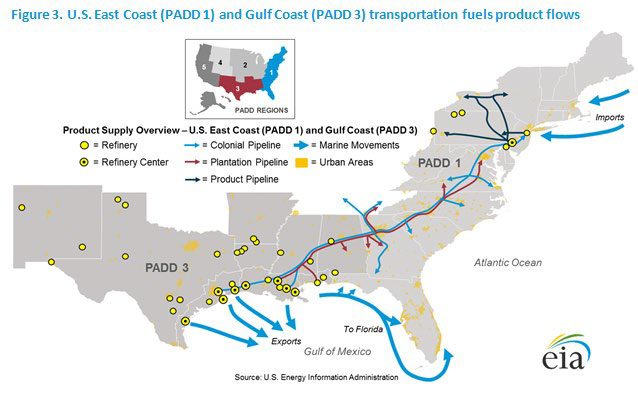
Despite its large fuel demand, the East Coast has limited refining capacity, and, as shown in Figure 3 below, the district relies heavily on imports from Europe and pipeline shipments from other regions, particularly the Gulf Coast (PADD 3).
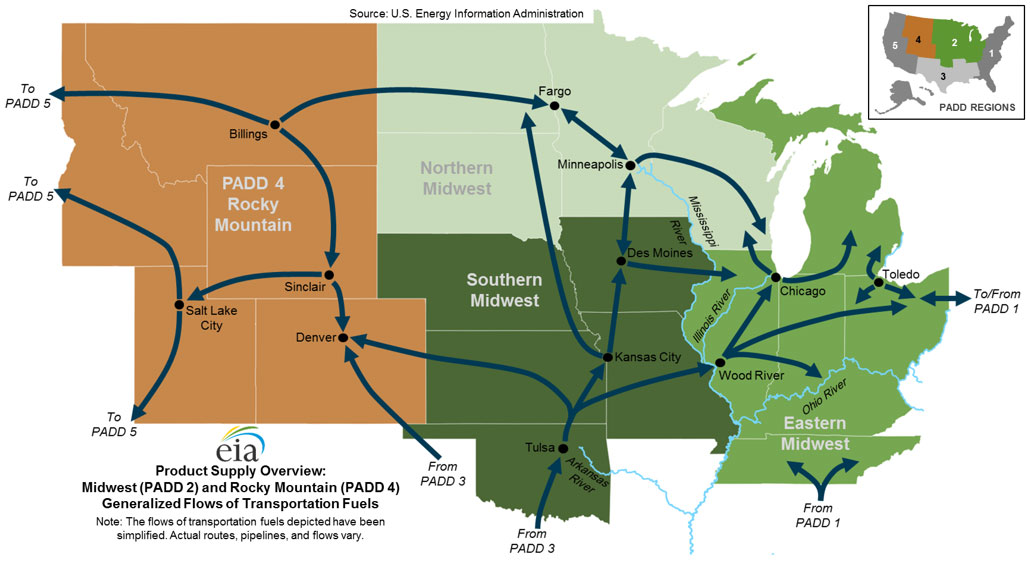
PADD 2 – Midwest – PADD 2 includes much of the nation’s agricultural and industrial heartland. It is a major refining center and a key destination for crude oil transported from Canada and U.S. shale-producing regions such as North Dakota’s Bakken formation. It also has the highest concentration of refined fuel pipelines of any region, spanning a wide region. Because the region is landlocked, many pipelines transport fuel between refining markets, as well as bringing fuel in and out of the PADD from other regions.
PADD 3 – Gulf Coast – Often referred to as the “engine room” of the U.S. petroleum system because it contains nearly half of U.S. refining capacity and more than half of U.S crude oil production, PADD 3 contains the highest concentration of refineries, petrochemical facilities, crude oil storage, and export terminals in the country. More importantly, the region plays a key role in supplying both domestic and global energy markets.
Nearly 75% of inter-PADD crude oil pipeline transfers were from PADD 3 → PADD 2. These flows represent Gulf of Mexico production and imports received on the Gulf Coast, which move inland to refineries in the Midwest. However, this has decreased as PADD 2 has increased its own production and imported more crude and energy products from Canada.
PADD 4 – Rocky Mountain Region – This region has fewer refineries and is relatively isolated from the other PADD regions due to its limited pipeline connectivity. As a result, fuel supply disruptions can cause pronounced local price volatility within the Rocky Mountain states.
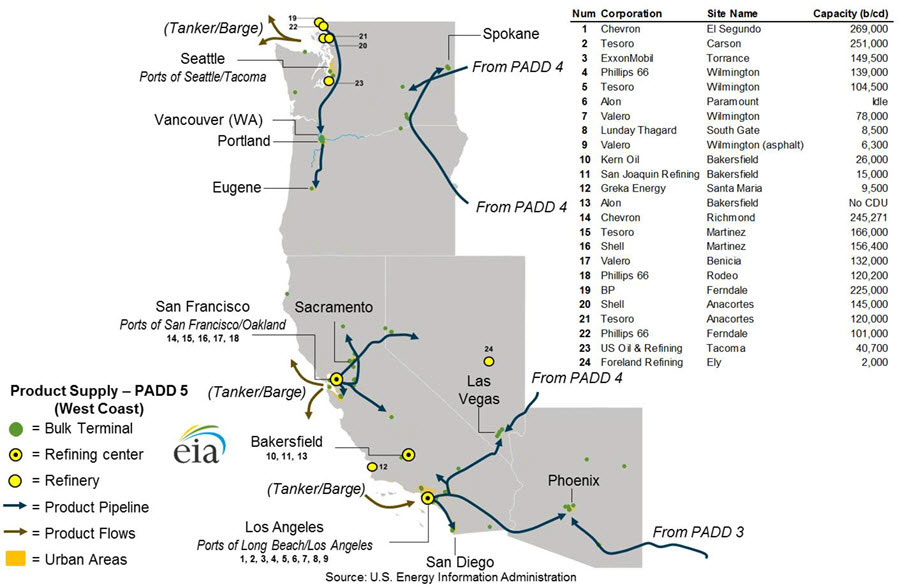
PADD 5 – West Coast – PADD 5 includes California, Alaska, Hawaii, and the Pacific Northwest. Due to its geographic isolation, specialized fuel standards (especially in California), and limited pipeline links to other PADDs, this region functions as a largely self-contained fuel market and often relies on imports from abroad. More recently, the closure of several West Coast refineries due to legislative and regulatory changes in California and parts of the Pacific Northwest has made this region even more reliant on energy imports from Alaska and overseas, despite the region’s ample energy reserves.
There are two additional districts, less frequently mentioned — PADDs VI and VII — that cover U.S. territories, although they are not typically shown on standard PADD maps.
Why are PADDs Important to the U.S. Energy Industry?
PADDs provide a standardized framework that allows analysts and federal agencies, such as the U.S. Energy Information Administration (EIA), to compare fuel supply, demand, and prices across regions. Without this structure, identifying regional imbalances or bottlenecks in the fuel system would be significantly more difficult. Important issues such as pipeline disruptions, refinery closures, energy price volatility, and even region-specific weather-related events can be more easily analyzed and addressed using the detailed information available through the PADD system. Just a few that are impacted by PADD data include:
Supply Chain and Infrastructure Planning
Refineries, pipelines, storage terminals, and shipping routes are often planned and evaluated using PADD level data. Understanding how fuels move between PADDs—especially from PADD 3 to PADDs 1 and 2—is essential for infrastructure investment and maintenance decisions. This is particularly important during peak demand months for gasoline and home heating oil (diesel).
Emergency Response and Energy Security
During hurricanes, refinery outages, or geopolitical disruptions, government agencies rely on PADD data to determine where shortages are likely to occur and how emergency fuel supplies should be allocated. The Strategic Petroleum Reserve (SPR), for example, is often analyzed in relation to PADD supply gaps.
Price Formation and Consumer Impact
Regional gasoline, diesel, and heating oil prices vary significantly across PADDs due to differences in refining capacity, environmental regulations, transportation costs, and access to imports. PADDs help explain why fuel prices in California or the Northeast differ significantly from those in the Gulf Coast or the Midwest.
Conclusion
Although created more than 80 years ago to address wartime fuel shortages, the Petroleum Administration for Defense Districts remain one of the most important organizing frameworks in the U.S. energy system. The PADD structure enables policymakers to manage supply disruptions, supports industry investment and infrastructure planning, and helps consumers and analysts understand regional fuel market dynamics. In an era defined by growing energy demand, evolving environmental policies, and heightened concern over the security and reliability of global supply chains, this longstanding framework continues to provide essential clarity and structure for the American petroleum industry and the broader U.S. economy. By improving market transparency and coordination, the PADD system enhances the overall value of the U.S. energy sector, helping ensure the delivery of reliable, affordable energy to U.S. consumers and our allies abroad.
Sources:
- https://www.eia.gov/analysis/transportationfuels/padd1n3/
- https://www.chesterenergyandpolicy.com/blog/petroleum-admin-defense-districts
- https://mansfield.energy/2022/08/24/what-is-it-padds-petroleum-administration-for-defense-districts/
- https://www.eia.gov/analysis/transportationfuels/padd5/
Images:
- https://www.eia.gov/petroleum/marketing/monthly/pdf/paddmap.pdf
- https://www.eia.gov/analysis/transportationfuels/padd1n3/
- https://www.eia.gov/analysis/transportationfuels/padd2n4/
- https://www.eia.gov/analysis/transportationfuels/padd5
ENERGY MARKETS BY THE NUMBERS
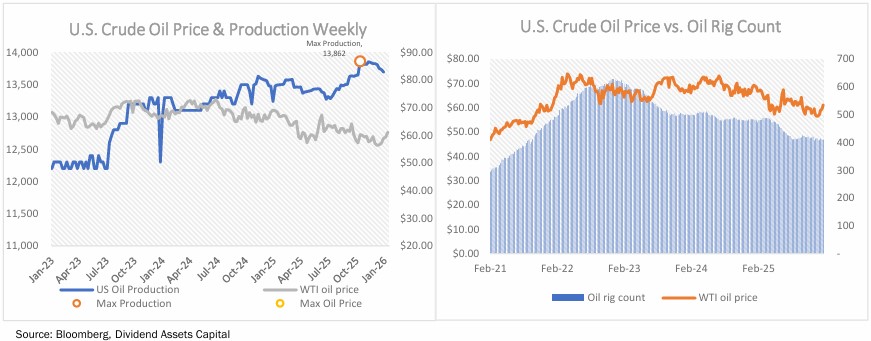
U.S. Total Crude Oil Production and U.S. Crude Rotary Rig Count (as of January 23, 2026):
- West Texas Intermediary (WTI) oil price was $60.70 per barrel (+6.0% m/m)
- U.S. oil production was 13.7mm bbl/d (+1.6% m/m)
- U.S. oil rig count was 411 (-0.24% m/m)
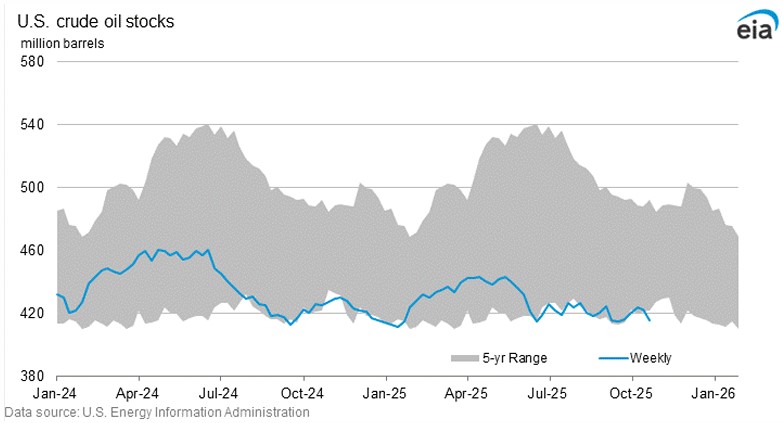
The U.S. Commercial Crude Oil Inventories (excluding those in the Strategic Petroleum Reserve) and Inventory Changes (As of January 23, 2026):
- Commercial inventories decreased by approximately 1 million barrels month over month to 423.8 million barrels (3.0% below the 5-year average). Inventories decreased by 2.3 million barrels from the previous week.
- Total crude stockpiles, including the Strategic Petroleum Reserve (“SPR”), increased by 1.0 million barrels month over month to 838.8 million barrels.
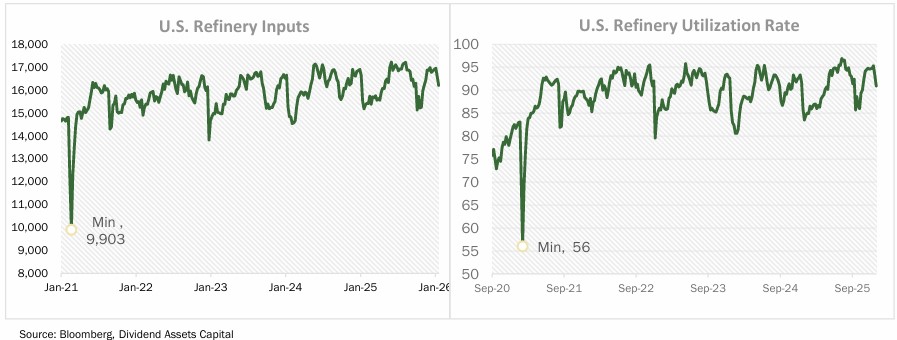
U.S. Refinery Inputs and Utilization Rates (as of January 23, 2026):
- U.S. crude oil refinery inputs averaged 16.2 mm bbl/d for the week of January 23, 2026. Four-week inputs averaged 16.9 million bbl/d, 6.1% higher than the same time a year ago.
- Refinery Utilization Rate was 93.6%, down from 94.6% for the previous month. However, this is higher than the same period last year, when the utilization rate was 88.6%.
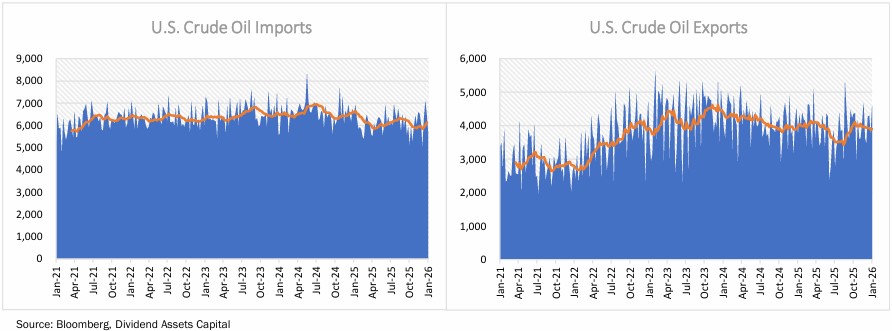
U.S. Imports and Exports (as of January 23, 2026):
- U.S. crude oil 4-week average imports were 6.2 mm bbl/d, up 5.7% month over month.
- U.S. crude oil 4-week average exports were 4.0 mm bbl/d, up 7.1% month over month.
This information is for illustrative purposes. Material presented has been derived from sources considered to be reliable, but the accuracy and completeness cannot be guaranteed. Nothing contained in this document may be relied upon as a guarantee, promise, assurance, or representation as to the future.
Dividend Assets Capital, LLC (“DAC”) is an investment adviser registered with the U.S. Securities and Exchange Commission. Registration does not imply a certain level of skill or training. More information about DAC investment advisory services can be found in its Form ADV Part 2, which is available upon request.
You should carefully consider the investment objectives, potential risks, management fees, and charges and expenses before investing. The Firm’s Investment Adviser Brochure, Form ADV Part 2, contains this and other information about the Firm, and should be read carefully before investing. You may obtain a current copy of DAC’s Form ADV Part 2 by visiting our website at dacapitalsc.com, emailing info@dacapitalsc.com, or by calling us at (866) 348-4769. Additional information about Dividend Assets Capital, LLC is also available on the United States Securities and Exchange Commission’s website at www.adviserinfo.sec.gov. You may search this site using a unique identifying number known as a CRD. DAC’s CRD is 129973. DAC-26-003
Dividend Assts Capital, LLC is an independent, employee-owned wealth advisor specializing in high quality companies with a history of consistently increasing dividends. Built on a pioneering legacy, our goal is straightforward; achieve our clients desired outcomes through investments that provide sustainable and rising income with long-term capital appreciation. We partner with successful families, advisors and institutions delivering tailored services that adhere to fiduciary principles to provide…
Clarity: A transparent and understandable approach to portfolio management.
Simplicity: We believe dividends are the best indicator of the future price performance of a stock.
Devotion: We build confidence through a disciplined process and strong devotion to our investment philosophy and clients.